Super Over 32
6 June 2025
Ball 1
Ashes tickets are selling with unprecedented speed.
It really is an incredible rivalry - especially when it is considered how uncompetitive recent series in Australia have been.
When do you think there was last a gap of less than two Tests between winner and loser?
The answer: 1986/87, when England won 2-1, back when Hawke and Thatcher were prime ministers! Since then it has been 3-0, 3-1, 3-1, 4-1, 5-0, 3-1, 5-0, 4-0, 4-0.
And most of the time it has been England who have been woeful.
At this point, any English person is required to say, ‘Well mate, Australia haven’t won a series in England since 2001.’
Well, yes, but . . .
Here is Australia’s record in England since 2001:
Tests: 30
Wins: 8
Losses: 14
Draws: 8
And here’s England’s record in Australia since 2001:
Tests: 30
Wins: 4
Losses: 23
Draws: 3
England last won a Test here in January 2011. Since then, they have played 15, lost 13 and drawn 2 (and in one of the draws they were 1 wicket from defeat).
Hopefully this time they can put up a fight worthy of the huge interest and expectation!

Ball 2
’But who would you leave out then?’
I got this question when I said for the umpteenth time that I would pick both Boland and Hazlewood in Australia’s eleven for the World Test Championship final.
My short answer is, ‘I don’t care’.
In my opinion, Boland and Hazlewood are currently our two best quicks and are automatic selections. I find it perverse how selectors - and the public - instead say something along the lines of, ‘Well Cummins is the captain so he must be in; Starc offers a point of difference so he is in; that leaves a choice between the other two.’
My approach is simple. Who are the best three quicks from the squad? And it is clear to me that they are Hazlewood, Boland and Cummins.
Starc is a fine bowler and would be unlucky to be left out. And yes, he does bring something different - and this is not nothing. But I think Boland is better than him - by quite a considerable margin - and this overwhelms any objections.
If Starc wins the game for Australia I will be delighted - but even this wouldn’t make me wrong. Pick your best players - it’s as simple as that.
Ball 3
In the wake of Glenn Maxwell’s retirement from ODI cricket it is worth reflecting on just what an incredible strike rate he had.
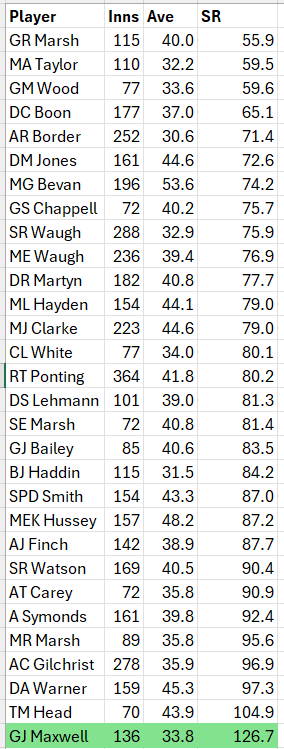
Here is the list of all Aussie men with 2,000 runs+ in ODIs, sorted by strike rate.
For dramatic tension I have sorted it in reverse order.
Please begin by gazing at our slowest ever: Geoff Marsh. Those of you too young to remember him might realise why I used to cheer him on to get out. A strike rate of 55.9 was diabolical, even allowing for the fact it was a slower era.
And then cast your eyes down to Maxi at the bottom!
126.7! It is absolutely incredible. Gilchrist - our fourth best - was the most entertaining player I had ever seen. Yet Maxi was 30 runs per hundred balls faster!
Sure, Maxwell could be frustrating - and there is an argument that he might have been better trying to up that average from 33.8 at the expense of his strike rate, even just a bit.
But that is by the by. He simply was the most entertaining Aussie ODI batter ever - and it is not even close.
Ball 4
There was some glorious ragebait from Cricket Australia this week.
They tweeted out their best 11 of the World Test Championship - and it included zero South Africans, even though South Africa topped the table. Kagiso Rabada was picked as 12th man - so I suppose that is something.
I can imagine the instructions given to their social media guy: ‘Make sure there are no South Africans; it will make for great clickbait!’
Here is the side:
Here are the best averages (min 500 runs) for the cycle:
So, when it has come to positions 3 through 6, Cricket Australia has, commendably, just gone on averages . . . with one glaring exception: South Africa’s Temba Bavuma.
And here is their confected gibberish for this decision:
It’s all about clicks!
Ball 5
Here’s a question: what matters more in T20 cricket: taking wickets or saving runs?
For example, who had the better season this IPL:
Josh Hazlewood: 8.77 runs per over and a wicket every 12.0 balls
Kuldeep Yadav: 7.07 runs per over and a wicket every 20.4 balls
The key is, ‘How much is a wicket worth?’ The answer might surprise you.
Several years ago, I asked this question to Professor Steven Stern (of the Duckworth-Lewis-Stern (DLS) Method).
He was extremely helpful - and, although there is no completely straightforward answer, on average, when a wicket falls in T20 cricket it reduces the expected team total in DLS by 5 runs.
Yep, just 5.
Scores have risen in the IPL since our chat, so I have decided to bump it up to 6 runs.
This year in the IPL, the average runs per over was 9.504 and a wicket was taken every 19.838 balls. Putting this together, with a wicket being worth 6 runs, here is the formula to work out how many runs per over a bowler saved/cost his team:
(If you’re interested in the derivation, please read the caption on the table).
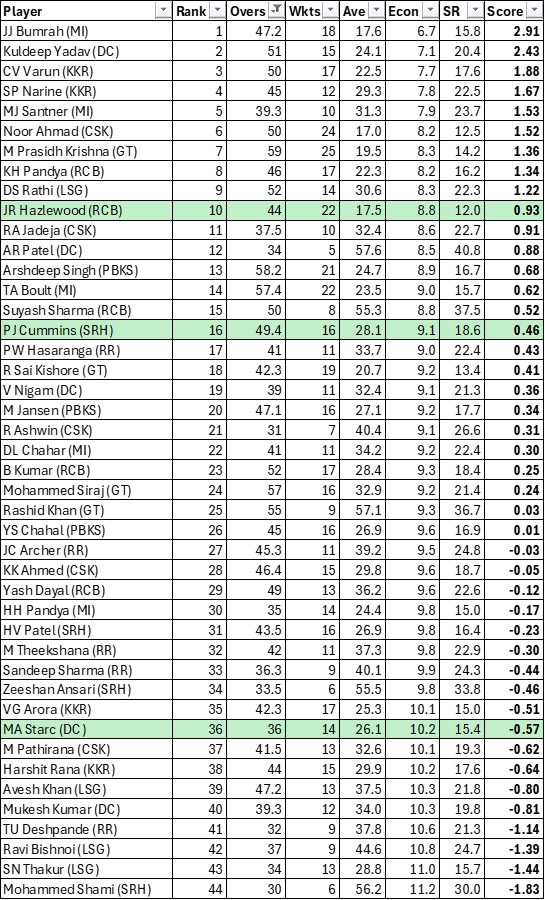
Here are the results for this year’s IPL, (minimum of 30 overs bowled, Aussies in green):

As expected, Bumrah comes out on top with a score of 2.91. That is to say, Bumrah was 2.91 runs per over better than a ‘typical’ bowler this IPL.
As for my earlier question re Hazlewood and Kuldeep Yadav, the answer is clear. Kuldeep was the second best bowler overall - 2.43 runs better than a typical bowler - whereas Hazlewood was 10th overall - 0.93 runs better than a typical bowler.
At the bottom of the table, poor old Shami was the worst bowler - 1.83 runs per over worse than a typical bowler.
What do you think?
Personally, I rather like it - and it reflects what I have long thought: spinners are more valuable than they are given credit for: 7 of the top 10 are spinners; 9 of the bottom 10 are seamers!
Ball 6
I tried to come up with a similar formula for batting.
I put a table together of averages and what I thought were equivalent strike rates and asked Chat GPT to back-form a formula for me, to allow average and strike rate to be combined into a single number.
After much hallucination and some bizarre quadratic equations, it finally produced one that seemed okay:
T20 batting formula = average + (strike rate - 100)/2
So, I applied this to the IPL figures and here are the top 15, plus all Aussies. (I made it minimum of 200 runs to be ranked but still included the Aussies who did not meet this mark (they are in grey and have ‘N/A’ as the rank).
I quite like the way the results look. They prioritise strike rate over average a bit more than is customary: for example, Kohli only finishes 14th best because although his average of 54.8 is superb, his strike rate of 144.7 is a bit low by IPL standards.
Had Tim David not done his hamstring he might well have finished top but he just fell short of the 200-run criterion.
As it is, Mitch Marsh was the best Aussie, and 9th best overall in the IPL and Suryakumar Yadav topped the list, just ahead of Nicholas Pooran. Each of those two had quite different seasons and I like how this metric allows a direct comparison.
What do you think?


I think you've got some click bait too! 😉
Don't think you give Starc anywhere near the credit he deserves. I agree Boland is as good but I'd never pick him over Starc (I would pick him over Hazlewood or maybe Cummins). Starc adds mongrel to the side that is unquantifiable that Boland doesn't have. And has a pretty well proven knack of picking up wickets at crucial points. You love your stats, yet don't refer to them with Starc. 382 at 27 and a SR of 48 is exceptional.
I would also say that's a very unfair assessment of Brook, who has been game-changing in his role. Bavuma may have a higher average but it's silly not to consider Brook. I can't stand him (and I love Bavuma) but you can't deny him. I'd back a WTC XI with Brook over one with Bavuma.
I don't say any of this to be mean, by the way, it's all fun debate and you do a great job.
Here's hoping England can win a fucking Test. Wild they have won one down here since that 11 series... which I remember very well. Everyone remember's Siddle's hat trick, but not us bowling on Trott's pads for the days thereafter as England notched up 1/500.
Some good stuff in here. On Ball 5: the average ‘cost’ of a wicket is 5 runs, but as I understand it this figure starts higher and diminishes as the innings goes on. So a wicket first ball of the innings has a cost much higher than 5, whereas a wicket off the last ball has a cost much closer to zero. Is it possible to build this into your model?!