

A glorious 2.3 days in Adelaide!
Super Over 12

Ball 1
Well that was wonderful.
The Adelaide Test was captivating, crowd records were smashed and Australia won well, thus avoiding embarrassment and setting up the rest of the series beautifully.
Boland was a perfect replacement for Hazlewood, Cummins roared back to his best, Starc was - as ever - devastating with the pink ball, Labuschagne and McSweeney scored tough runs, and Travis Head batted like Gilchrist/Bradman.
Much has been made of the Head-Siraj confrontation. I think the match referee got it about right: both players copped a slap on the wrist, Siraj’s a touch harder.
I don’t like sledging or send-offs. However, words said in the heat of the moment are sort of understandable and actually bother me a lot less than the incessant chatting and chirping that the Aussies used to be famous for.
In any case, the 10 minutes after the Head dismissal saw an Australian Test match crowd more engaged than I can recall in years.
I did not realise just how quiet Australian crowds are until I attended my first ever Test in England, at Trent Bridge in 2013.
It was wonderful.
The crowd - fully sold out - was only 17,500 for each day. Just months later, I was one of the 91,112 at the MCG on Boxing Day: still the largest official attendance in the history of Test match cricket.
Yet let me state clearly and literally - with no exaggeration: the Trent Bridge atmosphere was vastly better than the MCG.
Comically better. Embarrassingly better.
It was only the presence of the Barmy Army that gave the MCG much noise at all.
By contrast, the noise of the Jimmy Anderson chant at Trent Bridge was stunning; it still echoes in my mind a decade later.
Edgbaston 2019 was even better. True, I did get hit in the back of the head with some stonefruit pits (they were aimed at my neighbour) but it was the most I have ever enjoyed a Test match.

Why are Aussie crowds so quiet? I can think of four factors:
Australia wins so regularly at home there is often little jeopardy
The security clamp down of recent decades, especially on excess drinking
We don’t have the culture of singing at sport that, say, England does
We don’t realise how quiet we are. I had no idea until that 2013 England trip
I don’t want a return to the drunken abuse that I remember observing as a kid but I must say it was exhilarating, even just on television, to see an Aussie crowd so up for it.
It was good to see Siraj smiling at one point too. It cannot be pleasant being the villain but those that thrive on it can ultimately win the away fans’ respect. I earnestly hope that the inevitable pantomime booing he will cop in the coming Tests never degenerates into abuse.
Ball 2
The fan and media reaction to the Australian resurgence has been unsurprising.
The Aussies were insipid in Perth, so they say. They showed no courage, no character, no fight. The bearded beer-drinking players of yesteryear must have been appalled at how meekly these pampered modern softies caved in.
But, credit where it is due, the players had a long hard look at themselves. They came out in Adelaide and played with pride and heart and did not take a backward step. That’s what we expect from our team - it’s this level of effort that has seen us win so often!
I am sceptical.
I reckon Test match results tend to be determined by three factors:
Which side is better at cricket
Which side gets the better of conditions
One-off factors that skew a sample-size of one: dropped catches, umpiring decisions etc
As far as category 1 is concerned, I think the differences between Perth and Adelaide were:
Cummins bowled better in Adelaide
Starc bowled better in Adelaide
India struggled against the pink ball
In session 3 of day 1 in Adelaide India’s bowlers were a bit wayward. In the equivalent session in Perth they were not
Maybe Labuschagne batted with a bit more purpose in Adelaide too - although when he was 0* off 18 balls it was looking like Perth all over again.
As for categories 2 and 3 - I think Australia got the worst of conditions in Perth but not in Adelaide, and had Siraj caught Head and Pant caught McSweeney who knows what the result might have been.
Anyway, I am not complaining. The narratives we create around cricket are undeniably fun. I just don’t think they’re all that accurate!
Ball 3
So, which is the better cricket side?
You might recall last week I said that, on form to date, I thought India were slightly superior. I did also stress that this did not mean India would win in Adelaide - just that (excluding the draw) I thought the chances were about 55:45 to India.
Well, what about now?
I have a rudimentary rough-and-ready method of guesstimating this.
Below are my numbers for Brisbane based on expected elevens. For the first time ever, both sides have come out dead level ahead of a Test: each at 75%.
No doubt you will quibble with many of the individual scores. For example, how on earth could I rate Khawaja and Reddy equally?!
Probably if I did it all again from scratch I would come up with slightly different results. But, as they say, it is what it is.

This does not mean it will be a tie in Brisbane - although that would be great - but it does mean that whichever team gets the best of conditions and luck will win - according to me anyway!
Ball 4
As much as the Adelaide Test was enjoyable, many were left wanting more.
This led to a subscriber asking me just how strong the trend has been for Tests to be over quickly in recent times.
It is a worthy question.
I extracted the data - and quickly discovered that how I present the results makes a big impact on what conclusions can be drawn.
I’ll show you what I mean. Here is the raw data of balls-per Test, sorted by decades (except for the 1800s which I have lumped together):
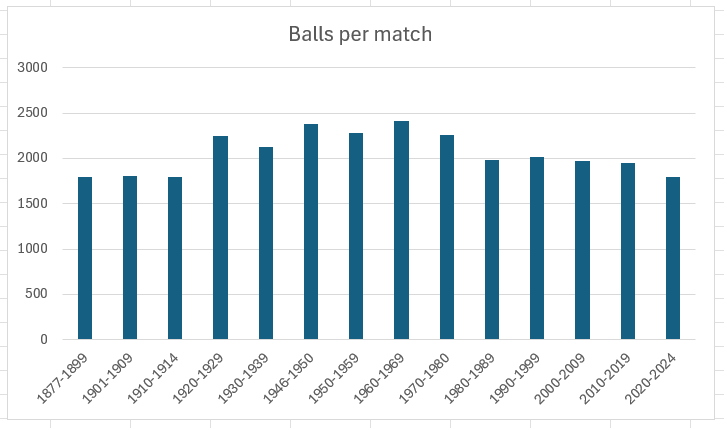
Nothing to see here, is there? There has been a slight drop off in the 2020s, sure, but on the whole, everything has been roughly the same for nearly half a century.
Or has it . . . ?
What about if I present the data differently. I’ll exclude everything from before 1970 (it’s just so long ago!) and also start the vertical axis higher than zero, to enable us to focus in.
Boom!
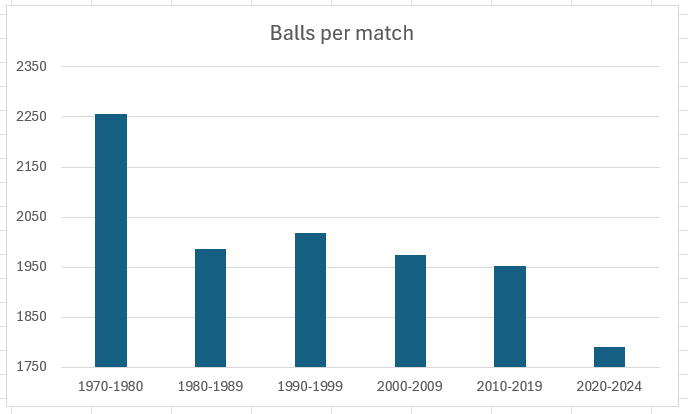
It is now seemingly crystal clear. Although ODIs began in the 1970s, they didn’t really get going until the 1980s - leading to an erosion in defensive techniques. This trend continued and then, into the IPL and Bazball era, it exploded.
That is how I would present it if I wrote for a newspaper and wanted to justify a narrative, (memo to potential hiring editors: please note my lack of scruples!)
Okay, now for the truth.
Here are the recent numbers broken down year-by-year with a vertical axis minimum of 1,500 balls: this focuses on the range of interest while still being visually proportional and fair.

To my eye, this is indicative of a trend.
It being 2024, I did the obvious and asked Chat GPT, which confidently affirmed that there has been a trend since 2010. It is always confident though - but not always right. Any mathematicians out there please get in touch if you wish to differ!

I definitely do understand the sentiment that it’s a pity Tests aren’t going deeper, but the entertainment factor cannot be denied. 2024 is a standout year: just 2% of Tests have been drawn, and the run rate has been 3.64 - which I am sure is the highest ever.
Ball 5
You might recall my excitement about Fergus O’Neill a few newsletters back. The young Victorian quick has a superb career bowling record (and a handy batting one too) and I said he might be in the Test side soon.
Next Shield game he duly went wicketless, lol.
But in his most recent game he took 8 wickets and he has just been signed by Nottinghamshire for 2025. Many Notts fans on Twitter have expressed their delight.
However, one Twitter comment gave me pause for thought, stating that maybe O’Neill has benefited from seam-friendly pitches in his three seasons of Shield cricket.
I had not considered this.
So I spent a pleasant few minutes immersed in Sheffield Shield data (living the dream!) and extracted the season averages for all bowlers from 2008/09 onwards. (I chose 2008/09 as it is the earliest season to feature any of our current Test line up, with Mitchell Starc making his Shield debut).
The bottom three seasons, in blue, are the seasons O’Neill has played.

It is hard to tell if there is a trend or not; 2022/23 and 2023/24 do seem to be a bit more bowler friendly, but only a little.
So I asked my mate Chat GPT again - and this time it said there was no trend; I am reassured that O’Neill’s numbers really are as impressive as I thought!
From my data, here are the top 11 Sheffield Shield bowling averages for the period 2008/09 to the present, minimum 80 wickets, only current players considered.

O’Neill holds up very well! Second overall in a list that includes four bowlers either still in the Test team or in contention for it (shaded in green).
Incidentally, Joel Paris at the top of the list has long been a favourite of mine. If he can have a protracted stint injury-free he might yet play Test cricket.
Lastly, speaking of bowling averages, in the midst of a disappointing Test for India there was one bright spot: having gone so close in Perth, Jasprit Bumrah did indeed finish this Test with an average under 20: it currently sits at a stunning 19.96.
Ball 6
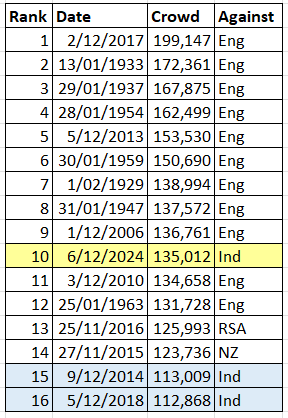
As expected, the Adelaide Test crowds were record breaking.
51,642 on day 2 was the third highest Adelaide crowd ever and 50,186 on day 1 was fifth.

And when I limit the numbers just to India Tests, the numbers become even more remarkable: three of the four biggest ever Adelaide crowds were in this Test, and the old record was broken by over 16,000!

Finally, the total attendance was the highest ever for a non-Ashes Test at Adelaide. Had it gone the full five days, who knows how high up the list it would have landed.
Yet in the Ashes next year, Adelaide will be back to a day Test, with Brisbane getting the day/nighter. Surely it is not too late: let Brisbane keep its day/nighter but give Adelaide its back as well and have two!